|
Marketmesa installs two programs: Stocks - a ready made database waiting for your data, and Charts. Together, they enable you to combine and chart the percent and actual performances of hundreds of entities at the same time in one screen - stocks, funds, ETFs, bonds, forex, global indexes, sales, resources, costs, donations, educational grades, housing forecasts and targets - KPI's (your imagination is the limit) - on just the important dates chosen by you.
Not all dates are created equal. Some dates and their events are more important than others. Your dates are the most important! You are not restricted to just weeks, months or other equal time segments. Sequential dates or up to any 16 dates can be chosen for your data visualization. Marketmesa™ comes with a free 21 day trial for comparing dates important to your business intelligence
 Back To Top Back To Top
Comparisons can be forward or backward in time
Each chosen date is an important event - today, past or future - with a real or target date value.
Marketmesa shows how you relate to the world - and how the world relates to you.
|
1. |
Forward method 1 [With-FROM] |
|
Choosing any oldest date, each of your newer chosen dates is compared with the oldest date. |
|
|
| |
Examples:
- How have your stocks and global indexes performed since a particular date?
- How has each product of your new product line performed since introduction?
- Compared to the competition?
- Using this method, how has the stock market performed?
- Benchmarking with either standardized or desired test results, each student
of an entire school system can be monitored at a glance. |
 |
|
2. |
Forward method 2 [Until-TO] |
|
Starting at any oldest date, each chosen date is compared with the next newer date. |
|
|
| |
Examples:
- Performances are displayed with each date compared with the next newer date.
- Using this method, how has the stock market performed?
- Benchmarking with either standardized or desired test results, each student
of an entire school system can be monitored at a glance. |
|
3. |
Backward method 1 [With-TO] |
|
Choosing any newest date [today, past or future with a real or target value] and looking back in time,
the newest date is compared with each of your older chosen dates. |
|
|
| |
Examples:
- With different purchase dates, how have your stocks and global indexes performed?
- With different introduction dates, how have your products performed?
- How well have your financial metrics improved?
- Using this method, how has the stock market performed?
- Benchmarking with either standardized or desired test results, each student
of an entire school system can be monitored at a glance. |
|
4. |
Backward method 2 [Until-FROM] |
|
Starting at any newest date and looking back in time, each chosen date is compared with the next older date. |
|
|
| |
Examples:
- Performances are displayed with each date compared with the next older date.
- Using this method, how has the stock market performed?
- Benchmarking with either standardized or desired test results, each student
of an entire school system can be monitored at a glance. |
| |
Back To Top |
Chart and Compare
Stock Software
- A ready-made database waiting for your data.
- All entites can be quickly chosen, changed and grouped for different comparisons.
- Import and merge multiple sources of historic data source files conforming to the simple export text formats of: Worden Bros.(R)TC2000™ Stocks or TC2000™ Mutual Funds!2
- Import and merge multiple sources of single day hourly text data source files conforming to Marketmesa's™ simple text format.
- Imported data and their sources can be identified - you know which data came from where and when.
Chart Software
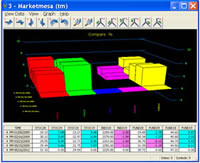
- 3D charts are fly-around and zoom navigated.
- A screen can have many charts, each a different comparison of any stocks, funds and dashboard entities - each automatically numbered for identification.
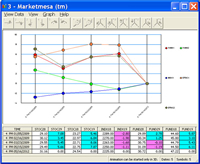
- 2D and 3D Charts are mouse-bubble active and optionally display correlated spreadsheet values - to keep you oriented in the chart data!
Back To Top
Data Sources
You provide the relevant data and Marketmesa turns it into comparison charting information related to the stock market, your business or the world. All data providers are Welcome! Data can be manually entered or, provided it is in the simple text format1, imported from multiple sources and compared. The program uses simple native text data from Worden Bros. TC2000 Stock and TC2000 Mutual Fund programs2- popular subscription fee services - they send free trial stock and fund CDs with which you can convert their trial data to the proper format for demonstration purposes - www.worden.com. 800-776-4940 Instructions are in Stocks' Help topic: Manual Import, sub-topic: Users of TC2000.
Data from any sources can be converted to the simple text format using an Extract, Transform and Load utility. ETLs are found via internet search and professional programming companies. ETLs found in Microsoft (R) Excel and Access might suffice for your data sources. Sample historic and single day hourly text data source files are also included as examples for creating your import files.
Data Backup
A built-in archive-restore utility can save all or part of your data's date range and optionally delete allowing an "uncluttered, clean sheet" with which to work. If data or the program become corrupted for any reason such as a wrong import format or power outage, the installed Marketmesa can simply be removed via Microsoft Windows(R) Control Panel Add/Remove Programs, re-installed and the data restored.
Chart and Compare
Features Up to how many data points can patented breakthrough technology Marketmesa visualize in one screen?
data points = your chosen entities (up to 126) x your chosen important event dates (up to 16) x calculated percent changes (dates) x number of 3D (x, y, z) charts.
Each chart can be a different collection of data points. Whether you need to monitor and/or compare the performances of a high or low number of data points, Marketmesa displays them all
with attention getting clarity.
General


- All data providers are Welcome!
- Import and merge multiple sources of historic datasource files conforming to the simple export text formats of: Worden
Bros.(R)TC2000™ Stocks or TC2000™ Mutual Funds!2
- Import and merge multiple sources of single day hourly text data source files conforming to Marketmesa's™ simple text format.1
- Imported data sources and data can be identified - you know which data came from where and when.
- Manually add and edit all single day hourly, symbol, name, date and price data - both actual historic data and projected future data - for a single day or range of dates.
- Values compared are -9999.99 to 99,999.99.
- Dates compared are 01/01/0100 to 12/31/9999.
- Values can be recorded on actual dates, or as events:
mm/01/yyyy = event 1, mm/02/yyyy = event 2, mm/03/yyyyy = event 3, etc.
- Comparisons can be made and all captured data displayed offline and on-the-go. There is no need to remain online or within available data reception. The entire program and data reside on your computer - there is no internet or shared server delay of time-sensitive comparisons.
- Optionally, when time or data reception permits, update mid-day with historic present and single day hourly data and continue comparisons!
- Databases can be entirely or partially emptied and backups saved to your chosen archives.
- Virtual PC and Terminal Services are enabled.
- For Windows 7 Professional and above: download XP Mode [ VM XP ] here
- Use Remote Desktop software like TeamViewer™ to run Marketmesa™ on your PC remotely from your iPad™ !
Back To Top
Single day Hourly 10-4pm - CH
- Each file of CH data can contain a single day of mid-day and closing prices assigned to 10-4pm hourly time slots.
- Up-to-the-moment present day CH data can be both imported and manually added for mid-day comparisons.
- Multiple sources of CH data files can be imported, merged and compared.
- CH data can be accumulated into a history of single dates and hours.
- You can create new CH entities with their symbols, names, dates and prices.
- CH data records can be edited or deleted.
- Each day of an entity's CH data can be copied to any range of CH dates.
- Multiple sources of H4 and CH data can be imported and displayed in the same comparison.
- Multiple sources of Historic 4pm data and present day CH 10-4pm data with the same symbols can be merged for mid-day comparisons.
- Multiple sources of single day CH 10-4pm data with different symbols than multiple sources of Historic 4pm data can all be compared at the same time.
Back To Top
Chart and Compare
Historic 4pm - H4
- Each file of H4 data can contain a date range of end-of-day closing and optionally present-day up-to-the moment prices assigned to the 4pm time slot.
- Multiple sources of H4 data files with contiguous and non-contiguous dates can be merged and compared.
- Large H4 files can be imported after the market closes, before the market opens or mid-day
- H4 data records can be deleted.
- Multiple sources of H4 and CH data can be imported and displayed in the same comparison.
- Multiple sources of Historic 4pm data and present day CH 10-4pm data with the same symbols can be merged for mid-day comparisons.
- Multiple sources of single day CH 10-4pm data with different symbols than multiple sources of Historic 4pm data can all be compared at the same time.
Screens, Charts, Spreadsheets, Reports and Exports
- All entites can be quickly chosen or changed for different comparisons by simply holding down an F8 or F9 selection key.
- Each 3D chart displays up to 126 entities, 2D charts display up to 22 entities - both with multiple chosen dates or sequential dates.
- 3D charts are fly-around and zoom navigated.
- A screen can have many charts, each a different comparison of any stocks, funds and dashboard entities - each automatically numbered for identification.
- Charts are mouse-bubble active and optionally display correlated spreadsheet values - to keep you oriented in the chart data!
- Reports reflect symbol-name assignments, comparison selections and results.
- A Process Log keeps track of imports, comparison exceptions and other important events.
- Export both imported source data and comparison results data.
Back To Top
|
Types of Data
- Marketmesa™ uses two types of data:
1. Single day Hourly 10-4pm - CH
2. Historic 4pm - H4.
- Entities can be stocks, funds, industries, indexes, sales, inventories, resources, dashboard metrics - compare the performances of anything!
- Prices can be substituted by any positive numeric values to be compared.
- Each different entity has a unique symbol condensed to it's first five imported or manually added alphanumeric characters.
- Each name can have up to twenty ascii characters. An ascii heirarchy chart is included in the program.
- Entity symbols and names can remain resident or be deleted with their data.
- Prices are imported as NAV = Net Asset Value and ANAV = Adjusted Net Asset Value.
- Single day Hourly 10-4pm - CH prices are NAV. Historic 4pm - H4 prices can be both NAV and ANAV.
- Imported CH and H4 files can have both actual historic and projected future data
- Data sources can be both public and private, depending upon your subscriptions and your sources' data format.1
- Imported data sources and data can be identified - you know which data came from where and when.
- Existing data can be exchanged with entirely different data using the internal backup-restore function.
- The available date range and data freshness is displayed with each new import, edit and backup procedure.
- Data can be imported manually or automatically from your hard drive using the internal scheduling function.
- Comparisons can include or exclude weekend data.
- Comparisons can be sequential dates - from any date and hour 10am-4pm until any date and hour 10am-4pm with all inbetween dates repeating a choice of hours 10am-4pm depending on your choice of H4, CH, or merged H4 and CH data.
- Comparisons can be just a list of chosen dates - from any date 4pm until any date and hour 10-4pm with a choice of any inbetween dates closing at 4pm - depending on your choice of H4, CH, or merged H4 and CH data.
- You can overwrite imported names of all entities with your favorite permanent names and sort them accordingly.
- Data is displayed with convenient sorts - Comparisons, data and charts are displayed your way!
- Maximum data capacity per copy of the program is approximately one billion records or two gigabytes. Please see Requirements
Chart and Compare
|
| |
|
1 ~ Please see System Requirements #1 |
|
2 ~ Marketmesa, LLC is not nor is it's Software affiliated with or endorsed by Worden Bros.(R). |
|
| | |