Marketmesa™ Charting Screenshots
Chart & Compare 100's of Stock and Dashboard Performances
- In 1 Screen!
The below 4 sets of 2D and 3D screenshots show
4 different methods of comparing the same 5 fictional stock market
entities with the same prices-values and same 5 dates. The optionally
displayed spreadsheet beneath each chart shows each entity's actual
price/value [symbols ending with 8] and it's percent changes [symbols
ending with 9]. The live program is mouse-bubble active - pointing
on a chart shows each symbol, date, value and percent change.
Not all dates are created equal. Some dates
and events are more important than others. You are not restricted
to just months, quarters, years or equal time segments. Up
to any 16 dates can be chosen for your data visualization. Marketmesa
comes with a free 21 day trial for comparing dates important to you.
Marketmesa shows how you relate to the world -
and how the world relates to you. A screen can have many charts,
each a different comparison of any stocks, funds and dashboard entities
- each automatically numbered for identification. 3D charts are fly-around
and zoom navigated.
Both 2D and 3D charts show the same data. Displayed
screenshots are low resolution for quick download.
Chart and Compare
Forward method 1 [With-FROM]
Choosing any oldest date, each of your newer chosen dates is compared
with the oldest date.
Examples:
How have your stocks and global
indexes performed since a particular date?
How
has each product of your new product line performed since introduction?
Compared
to the competition?

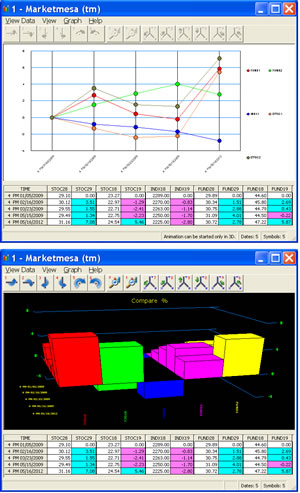
Chart and Compare
 Back
To Top Back
To Top
Forward
method 2 [Until-TO]
Starting at any oldest date, each chosen date is compared with the
next newer date.
Examples:
Performances
are displayed with each date compared with the next newer date.
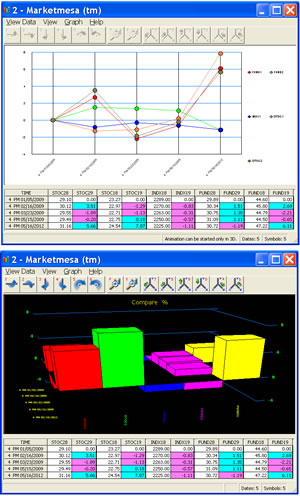
Chart and Compare
Back
To Top
Backward
method 1 [With-TO]
Choosing any newest date [today, past
or future with a real or target value] and looking back in
time, the newest date is compared with each of your older chosen
dates.
Examples:
With different
purchase dates, how have your stocks and global indexes performed?
With
different introduction dates, how have your products performed?
How
well have your financial metrics improved?
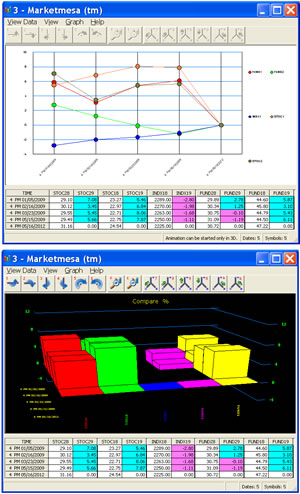
Chart and Compare
Back
To Top
Backward
method 2 [Until-FROM]
Starting at any newest date and looking back in time, each chosen date
is compared with the next older date.
Example:
Performances are
displayed with each date compared with the next older date.
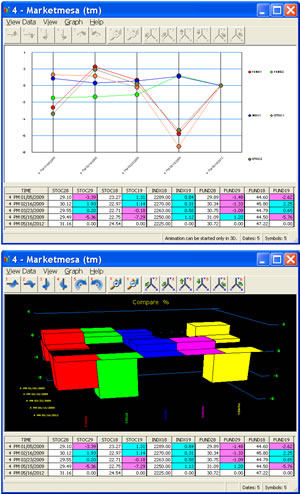
Chart and Compare
Back
To Top
Marketmesa™, Chart & Compare ™, Your World at a Glance™ and Dashboard Performances ™ are trademarks of
Marketmesa, LLC New Jersey
All other trademarks are the property of their respective owners.
Marketmesa
Software and Marketmesa.com (c) 1993- Marketmesa, LLC |